Bernd
 11/02/2018 (Fri) 12:29:19
No.20427
del
11/02/2018 (Fri) 12:29:19
No.20427
del
11/02/2018 (Fri) 12:29:19
No.20427
del
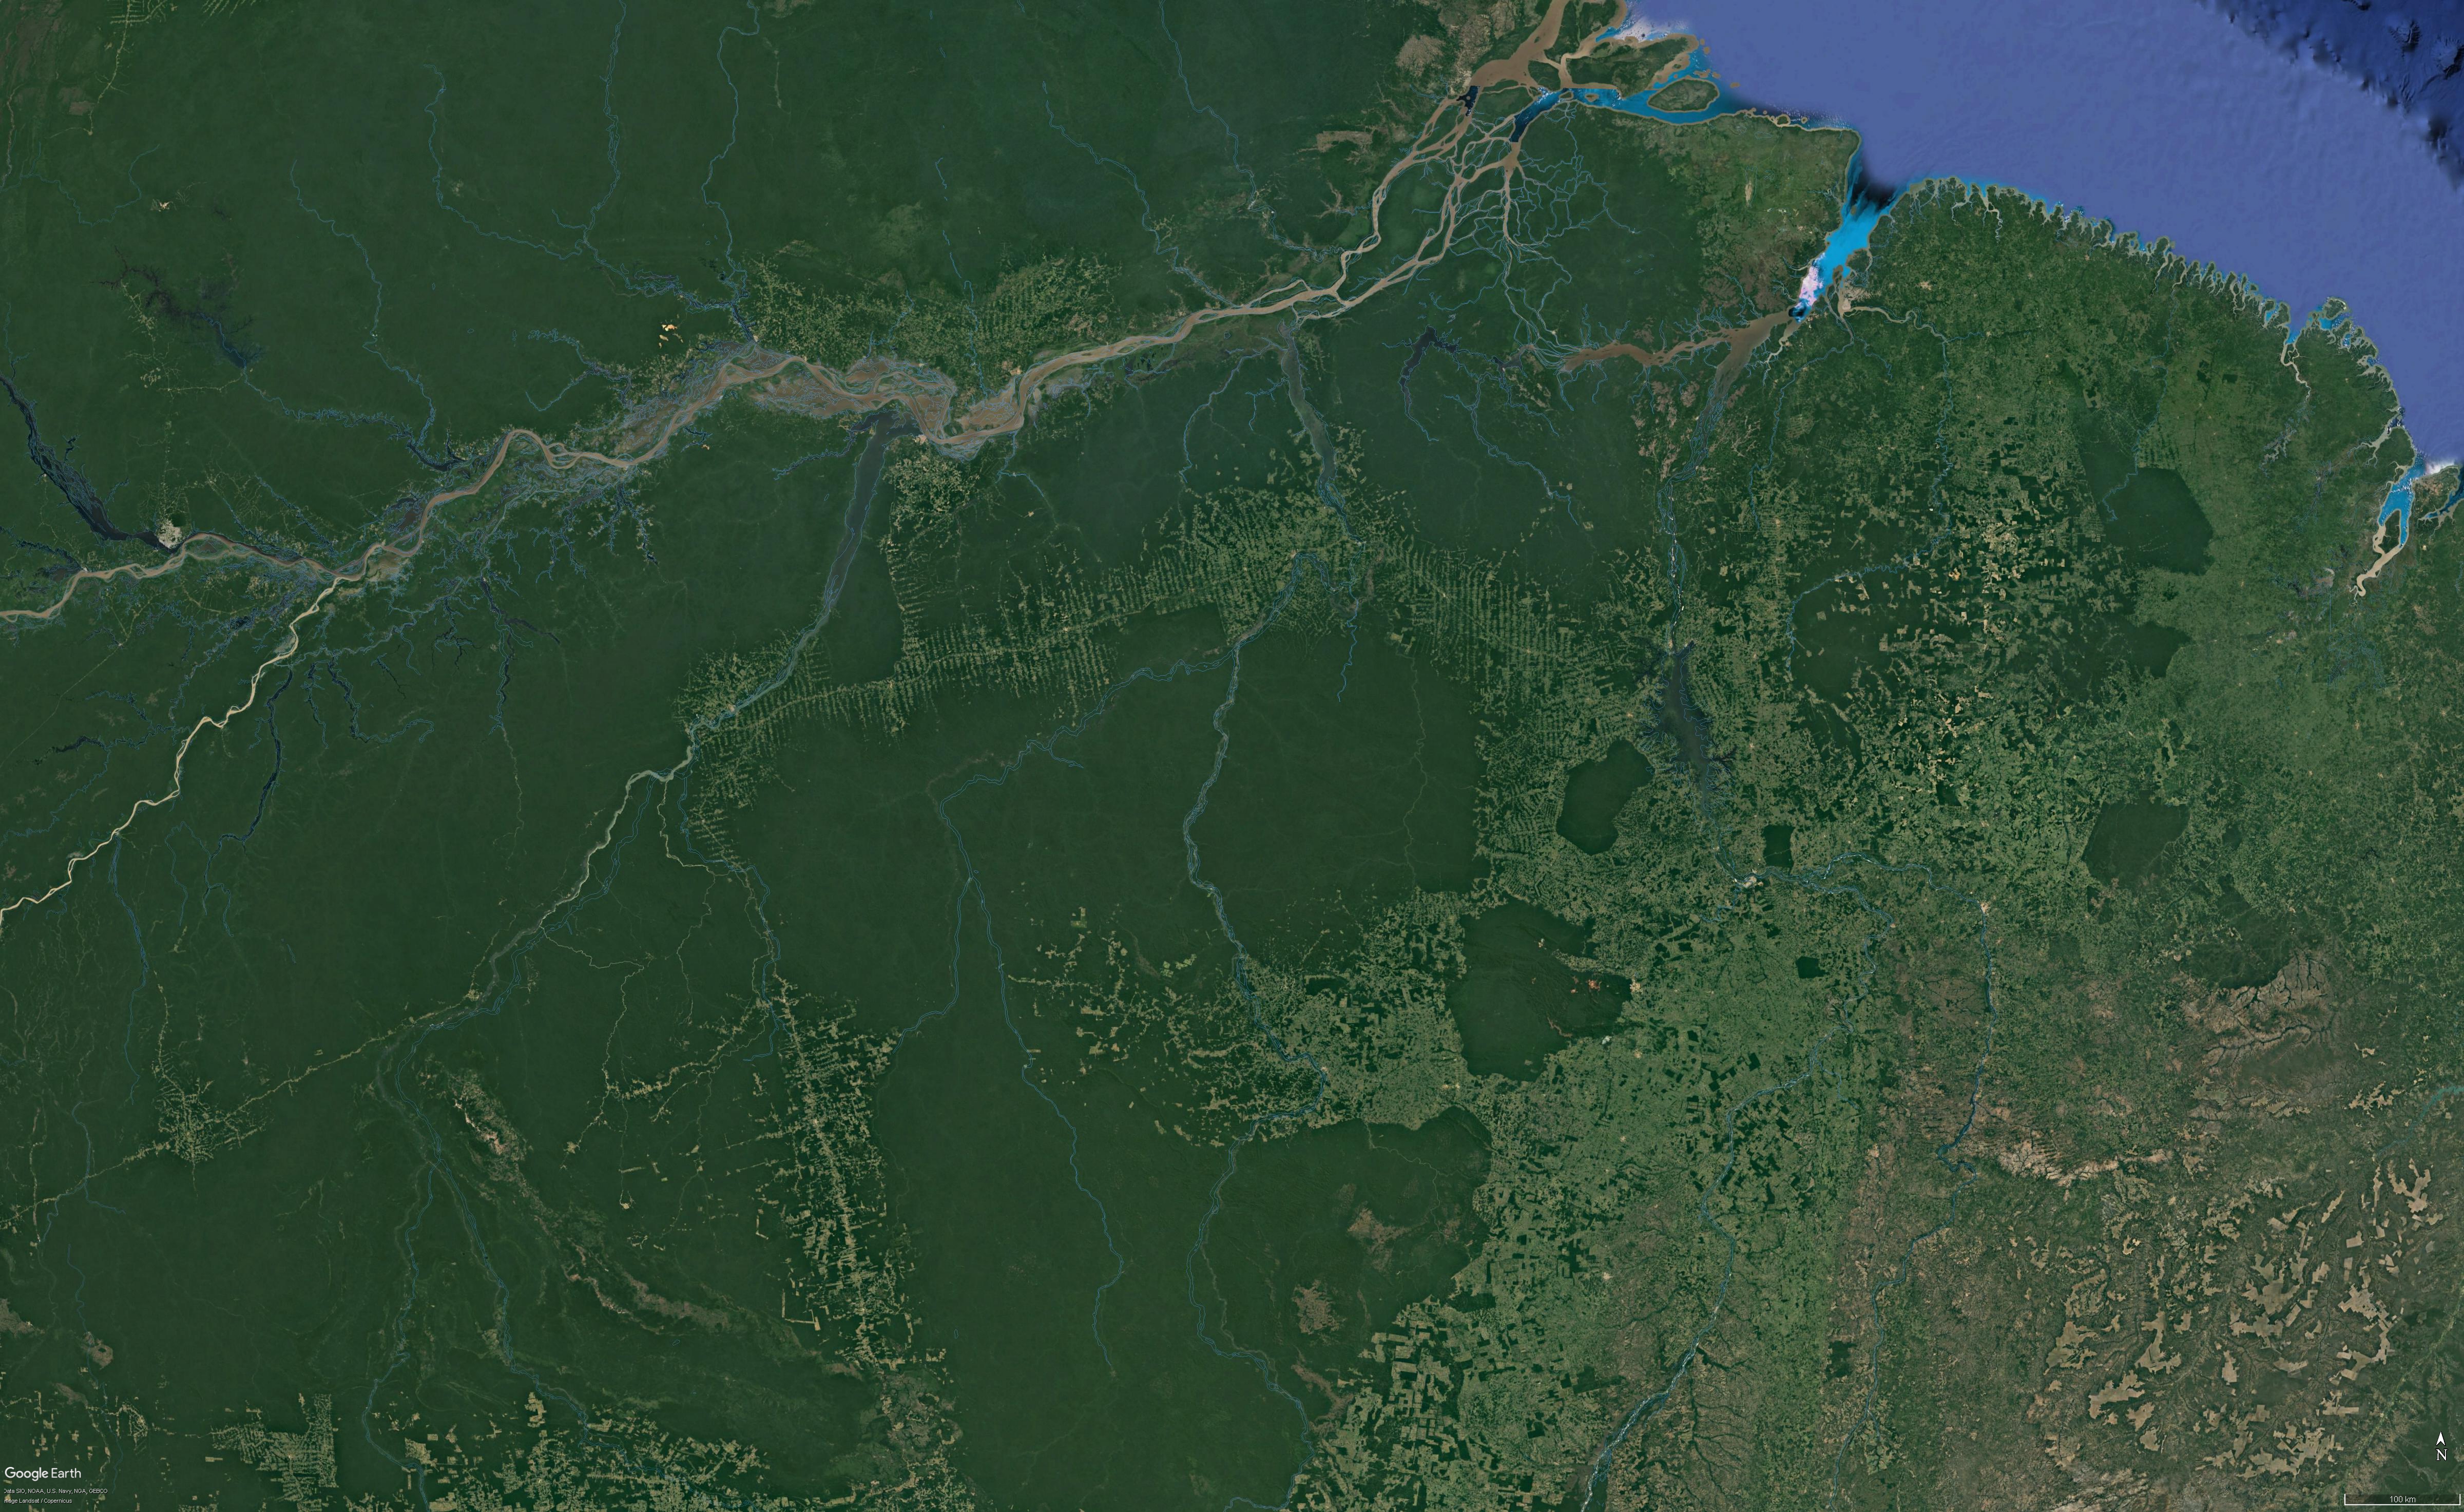
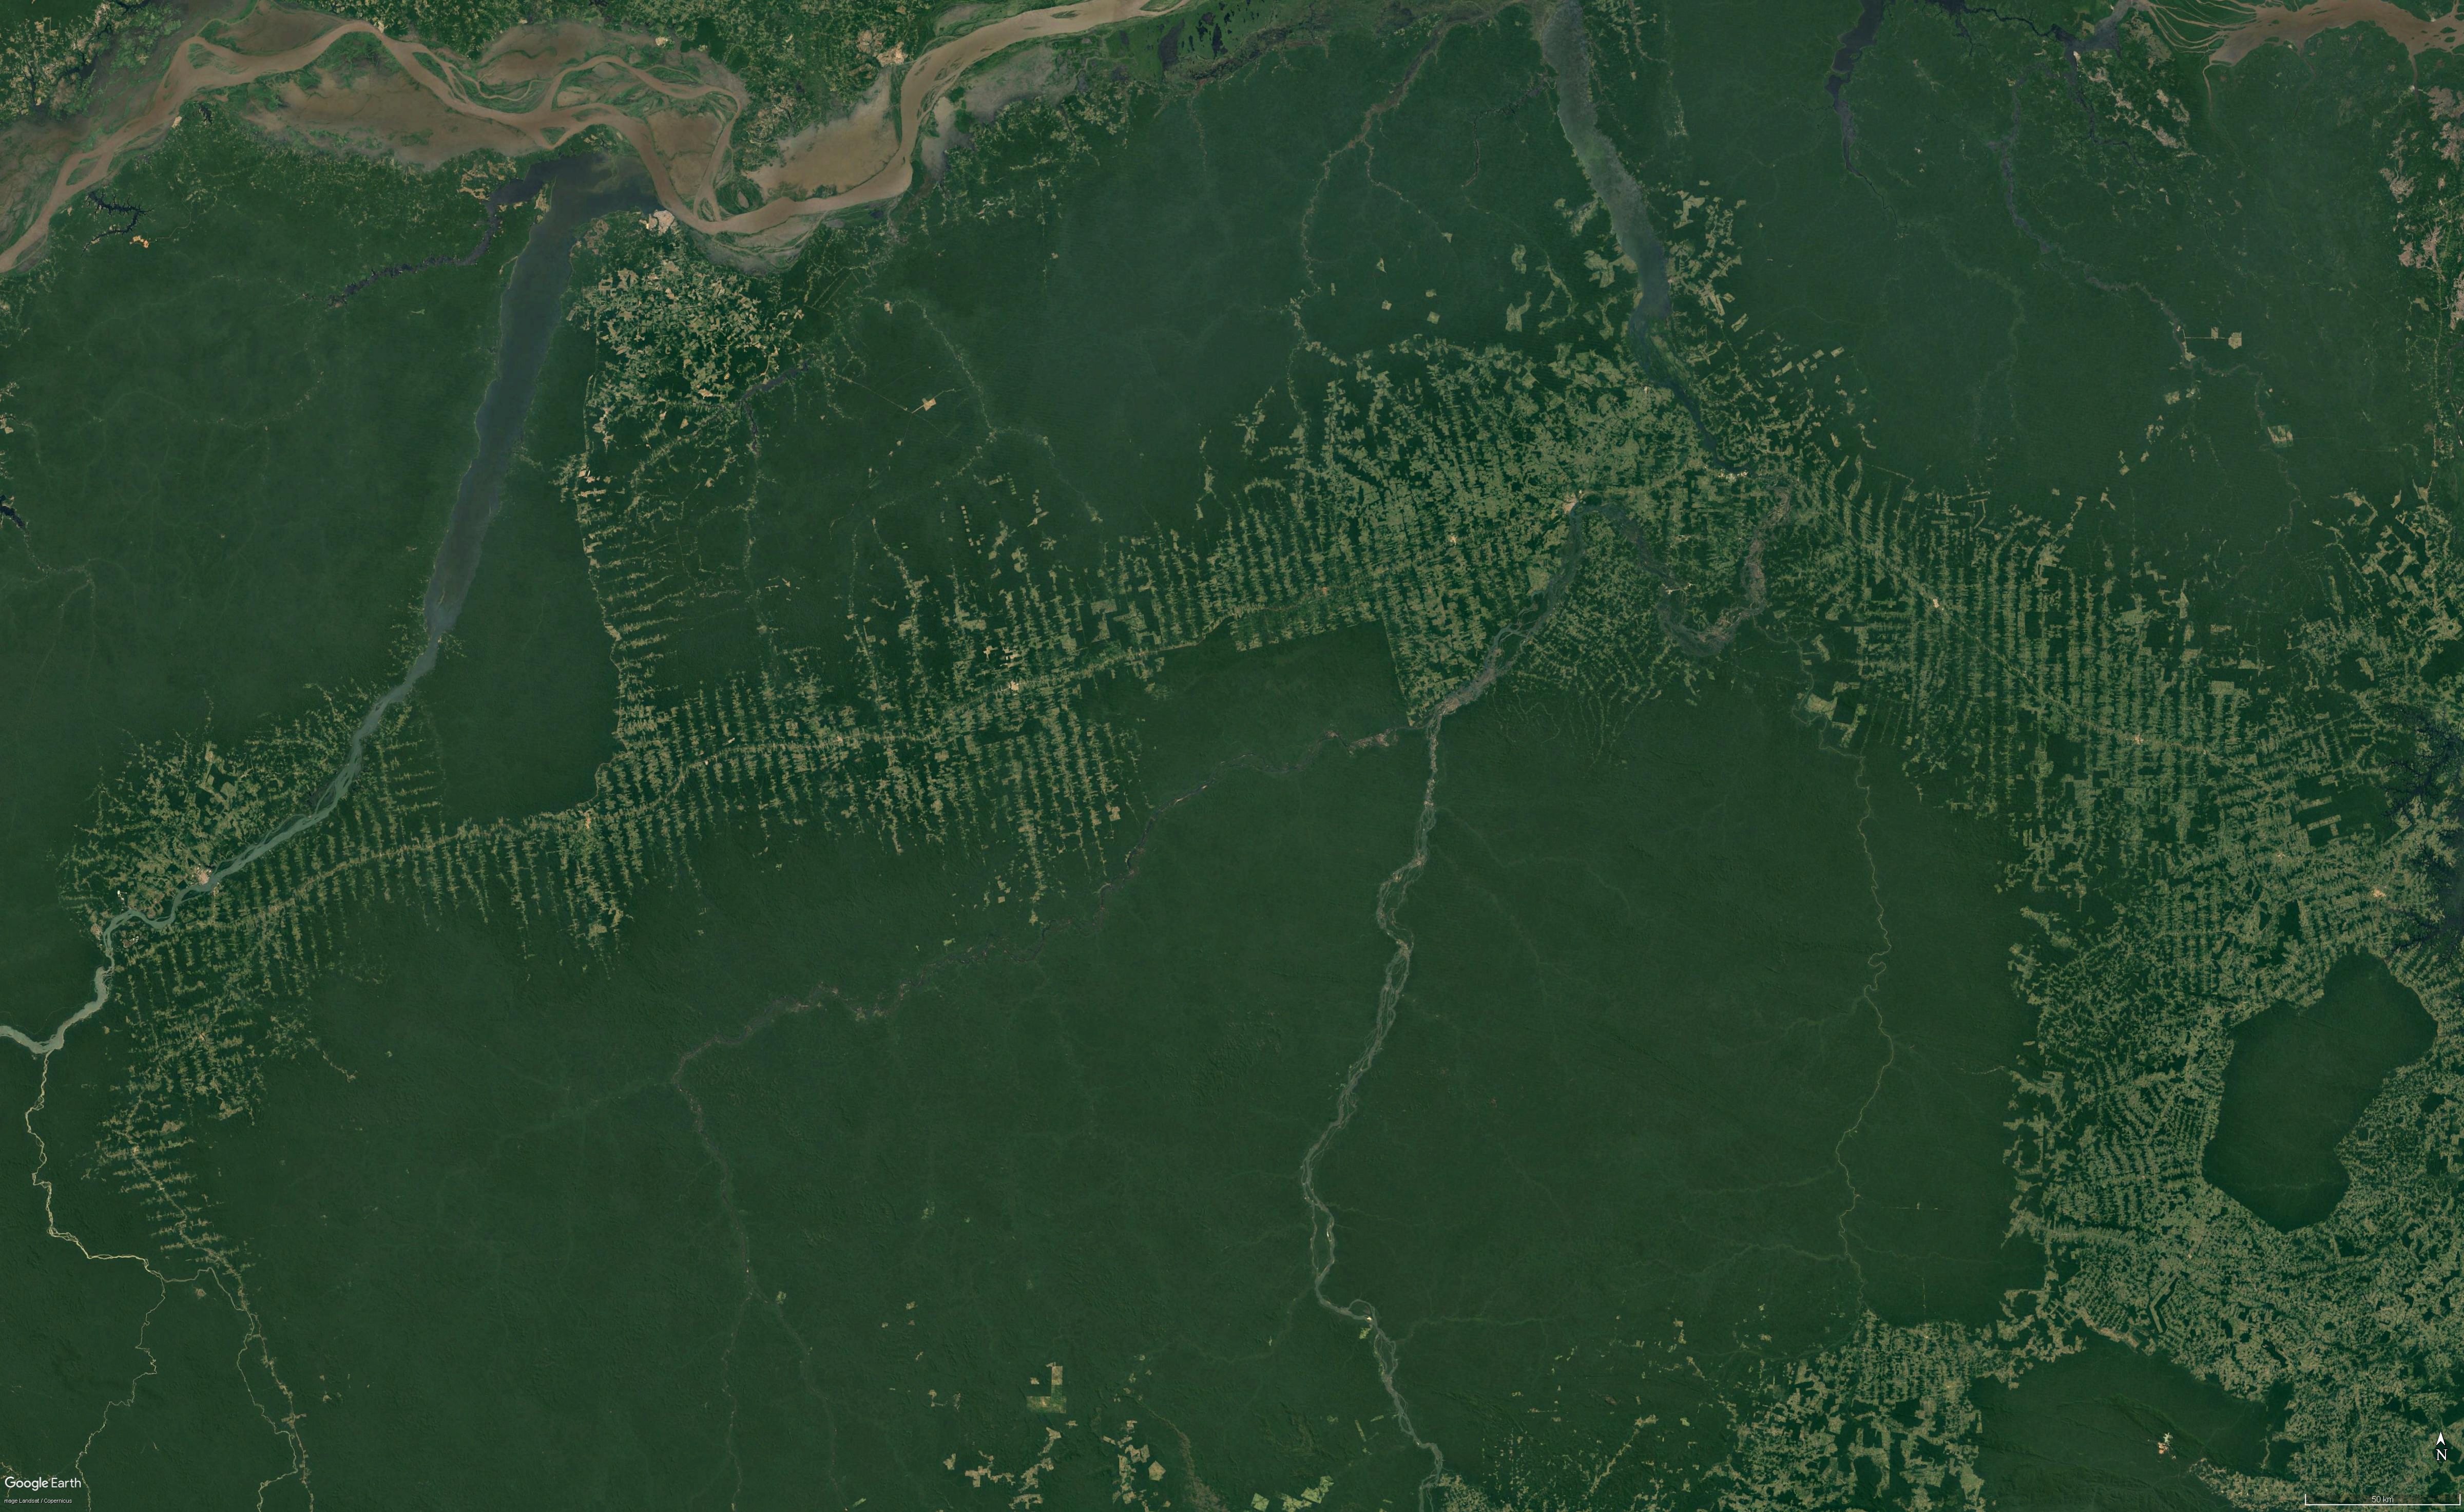
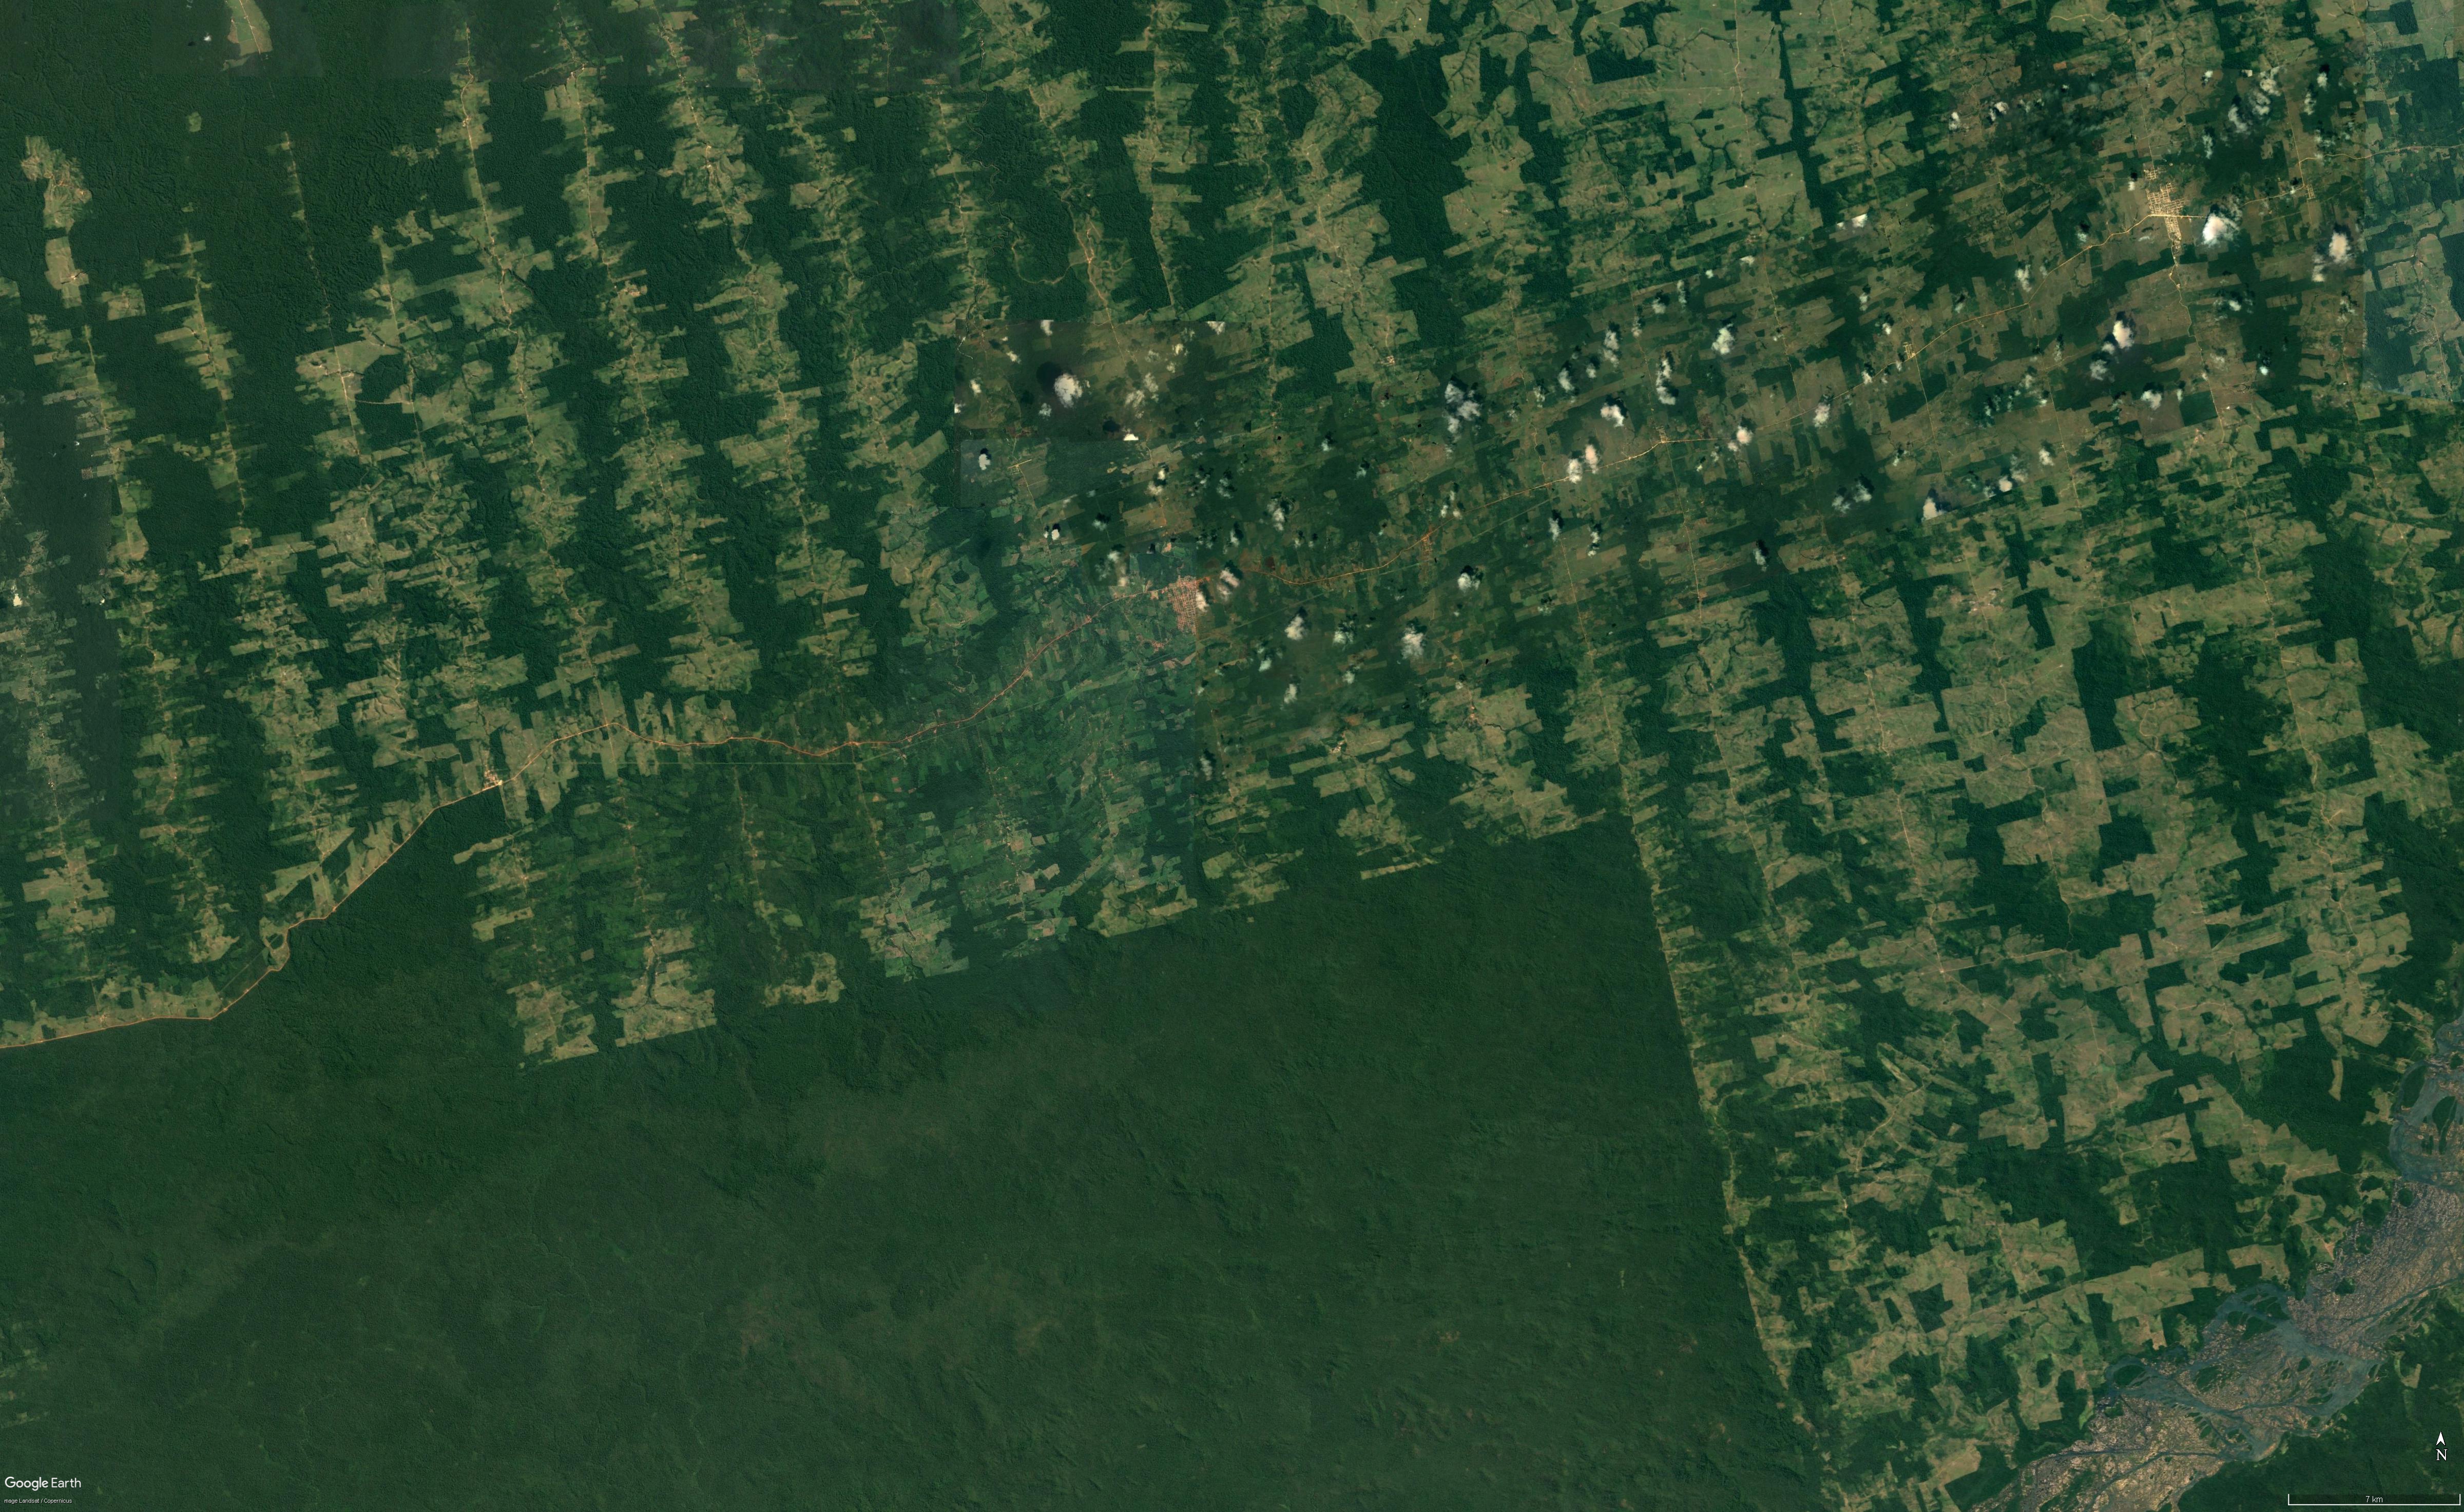
A stretch of the infamous BR-230/Transamazonian highway, where the previously described pattern of deforestation is also visible. If you pay attention, you can see it cutting through the jungle at an altitude of as much as 30 thousand km.
>>20422
A while ago an American base in Syria accidentally showed up on that map (or some other athletic tracking service) because servicemen were using it.
There are visible differences in usage from country to country and region to region, as is clear within Belgium. I wonder if it'd be possible to multiply every region's heat in order to correct it to someothing closer to its population and thus get a "pure" map representing only road usage rather than road usage + app usage. Some lesser roads do not appear at all in areas where the service sees little use, but relatively dense areas (such as the Rhineland) seen with a low resolution would appear quite close to the densest areas (England, Flanders).
>These aren't sat images either, but at least real aerial photos.
They're good enough for the purpose of this thread.